Object Detection from 9 FPS to 650 FPS in 6 Steps
September 30, 2020
Intro #
Making code run fast on GPUs requires a very different approach to making code run fast on CPUs because the hardware architecture is fundamentally different. If you come from a background of efficient coding on CPU then you’ll have to adjust some assumptions about what patterns are best.
Machine learning engineers of all kinds should care about squeezing performance from their models and hardware — not just for production purposes, but also for research and training. In research as in development, a fast iteration loop leads to faster improvement.
This article is a practical deep dive into making a specific deep learning model (Nvidia’s SSD300) run fast on a powerful GPU server, but the general principles apply to all GPU programming. The SSD300 is an object-detection model trained on COCO, so output will be bounding boxes with probabilities for 81 classes of object.
How Far Can We Push a Python-based Inference Pipeline? #
Part of the point of this article is to see what throughput we can get without leaving behind the flexibility of Python or the familiarity of the library the model was created with (Pytorch). We will not go super deep into custom CUDA kernels or use a standard “serving” framework because we will find many large optimizations available at a high level. We’ll start from a naively implemented simple video inference pipeline, following on from my introductory Pytorch Video Pipeline article.
Sample code is here: github.com/pbridger/pytorch-video-pipeline.
Stage 0: PyTorch Hub Baseline #
| Code | Nsight Systems Trace | Gstreamer Pipeline |
|---|---|---|
| tuning_baseline.py | tuning_baseline.qdrep | tuning_baseline.pipeline.dot.png |
The baseline version of the code will use the postprocessing functions in the SSD300 repo as per the PyTorch Hub page. The implementers of this model do not pretend this sample code is production ready and we will find many ways to improve it. In fact, the published benchmarking results for this model do not run the postprocessing code at all.
Top-level per-frame processing logic looks like this:
def on_frame_probe(pad, info):
    global start_time, frames_processed
    start_time = start_time or time.time()

    with nvtx_range('on_frame_probe'):
        buf = info.get_buffer()
        print(f'[{buf.pts / Gst.SECOND:6.2f}]')

        image_tensor = buffer_to_image_tensor(buf, pad.get_current_caps())
        image_batch = preprocess(image_tensor.unsqueeze(0))
        frames_processed += image_batch.size(0)

        with torch.no_grad():
            with nvtx_range('inference'):
                locs, labels = detector(image_batch)
            postprocess(locs, labels)

        return Gst.PadProbeReturn.OK
The important parts are highlighted above:
buffer_to_image_tensorconverts Gstreamer buffers (decoded from video frames) into Pytorch tensors.preprocessturns the 0 to 255 integral RGB pixel values into scaled -1.0 to +1.0 float values.detector(image_batch)runs the SSD300 model, and it’s important to note that the model and input tensor are on a CUDA device (GPU) at this point.postprocessturns model output into bounding boxes and scores for each class label.
We will dig into these functions later, for now let’s examine baseline performance.
Tracing with Nvidia Nsight Systems #
Nsight Systems is a great tool to help with high-level GPU tuning. It shows CPU/GPU resource utilization, and is able to trace OS system calls, CUDA, CuDNN, CuBLAS, NVTX and even some technologies we don’t care about.
NVTX is an important API we’ll use for instrumenting regions and events in our code — this will be allow us to map traced utilization patterns to logic in the code.
Having run the baseline video pipeline with tracing enabled, opening Nsight Systems shows around 40 seconds of activity decoding and processing the video file (click for full resolution):

As you can see, there is plenty of information. Nsight Systems shows:
- Resource utilization over time aggregated by hardware device (different CPUs and GPUs).
- Resource utilization over time aggregated into processes and threads.
- Call duration for numerous toolkits, including OS calls and the custom NVTX ranges I’ve put in our code. These will become clear as we zoom in.
I’ve added annotations for some problems that are clear even at this very high level. CPU usage is high, GPU usage is low, and there are a lot of memory transfers between host (system memory) and device (GPU memory).
Let’s drill in to show processing for a couple of frames. Note the NTVX ranges in grey corresponding to logical parts of the code:
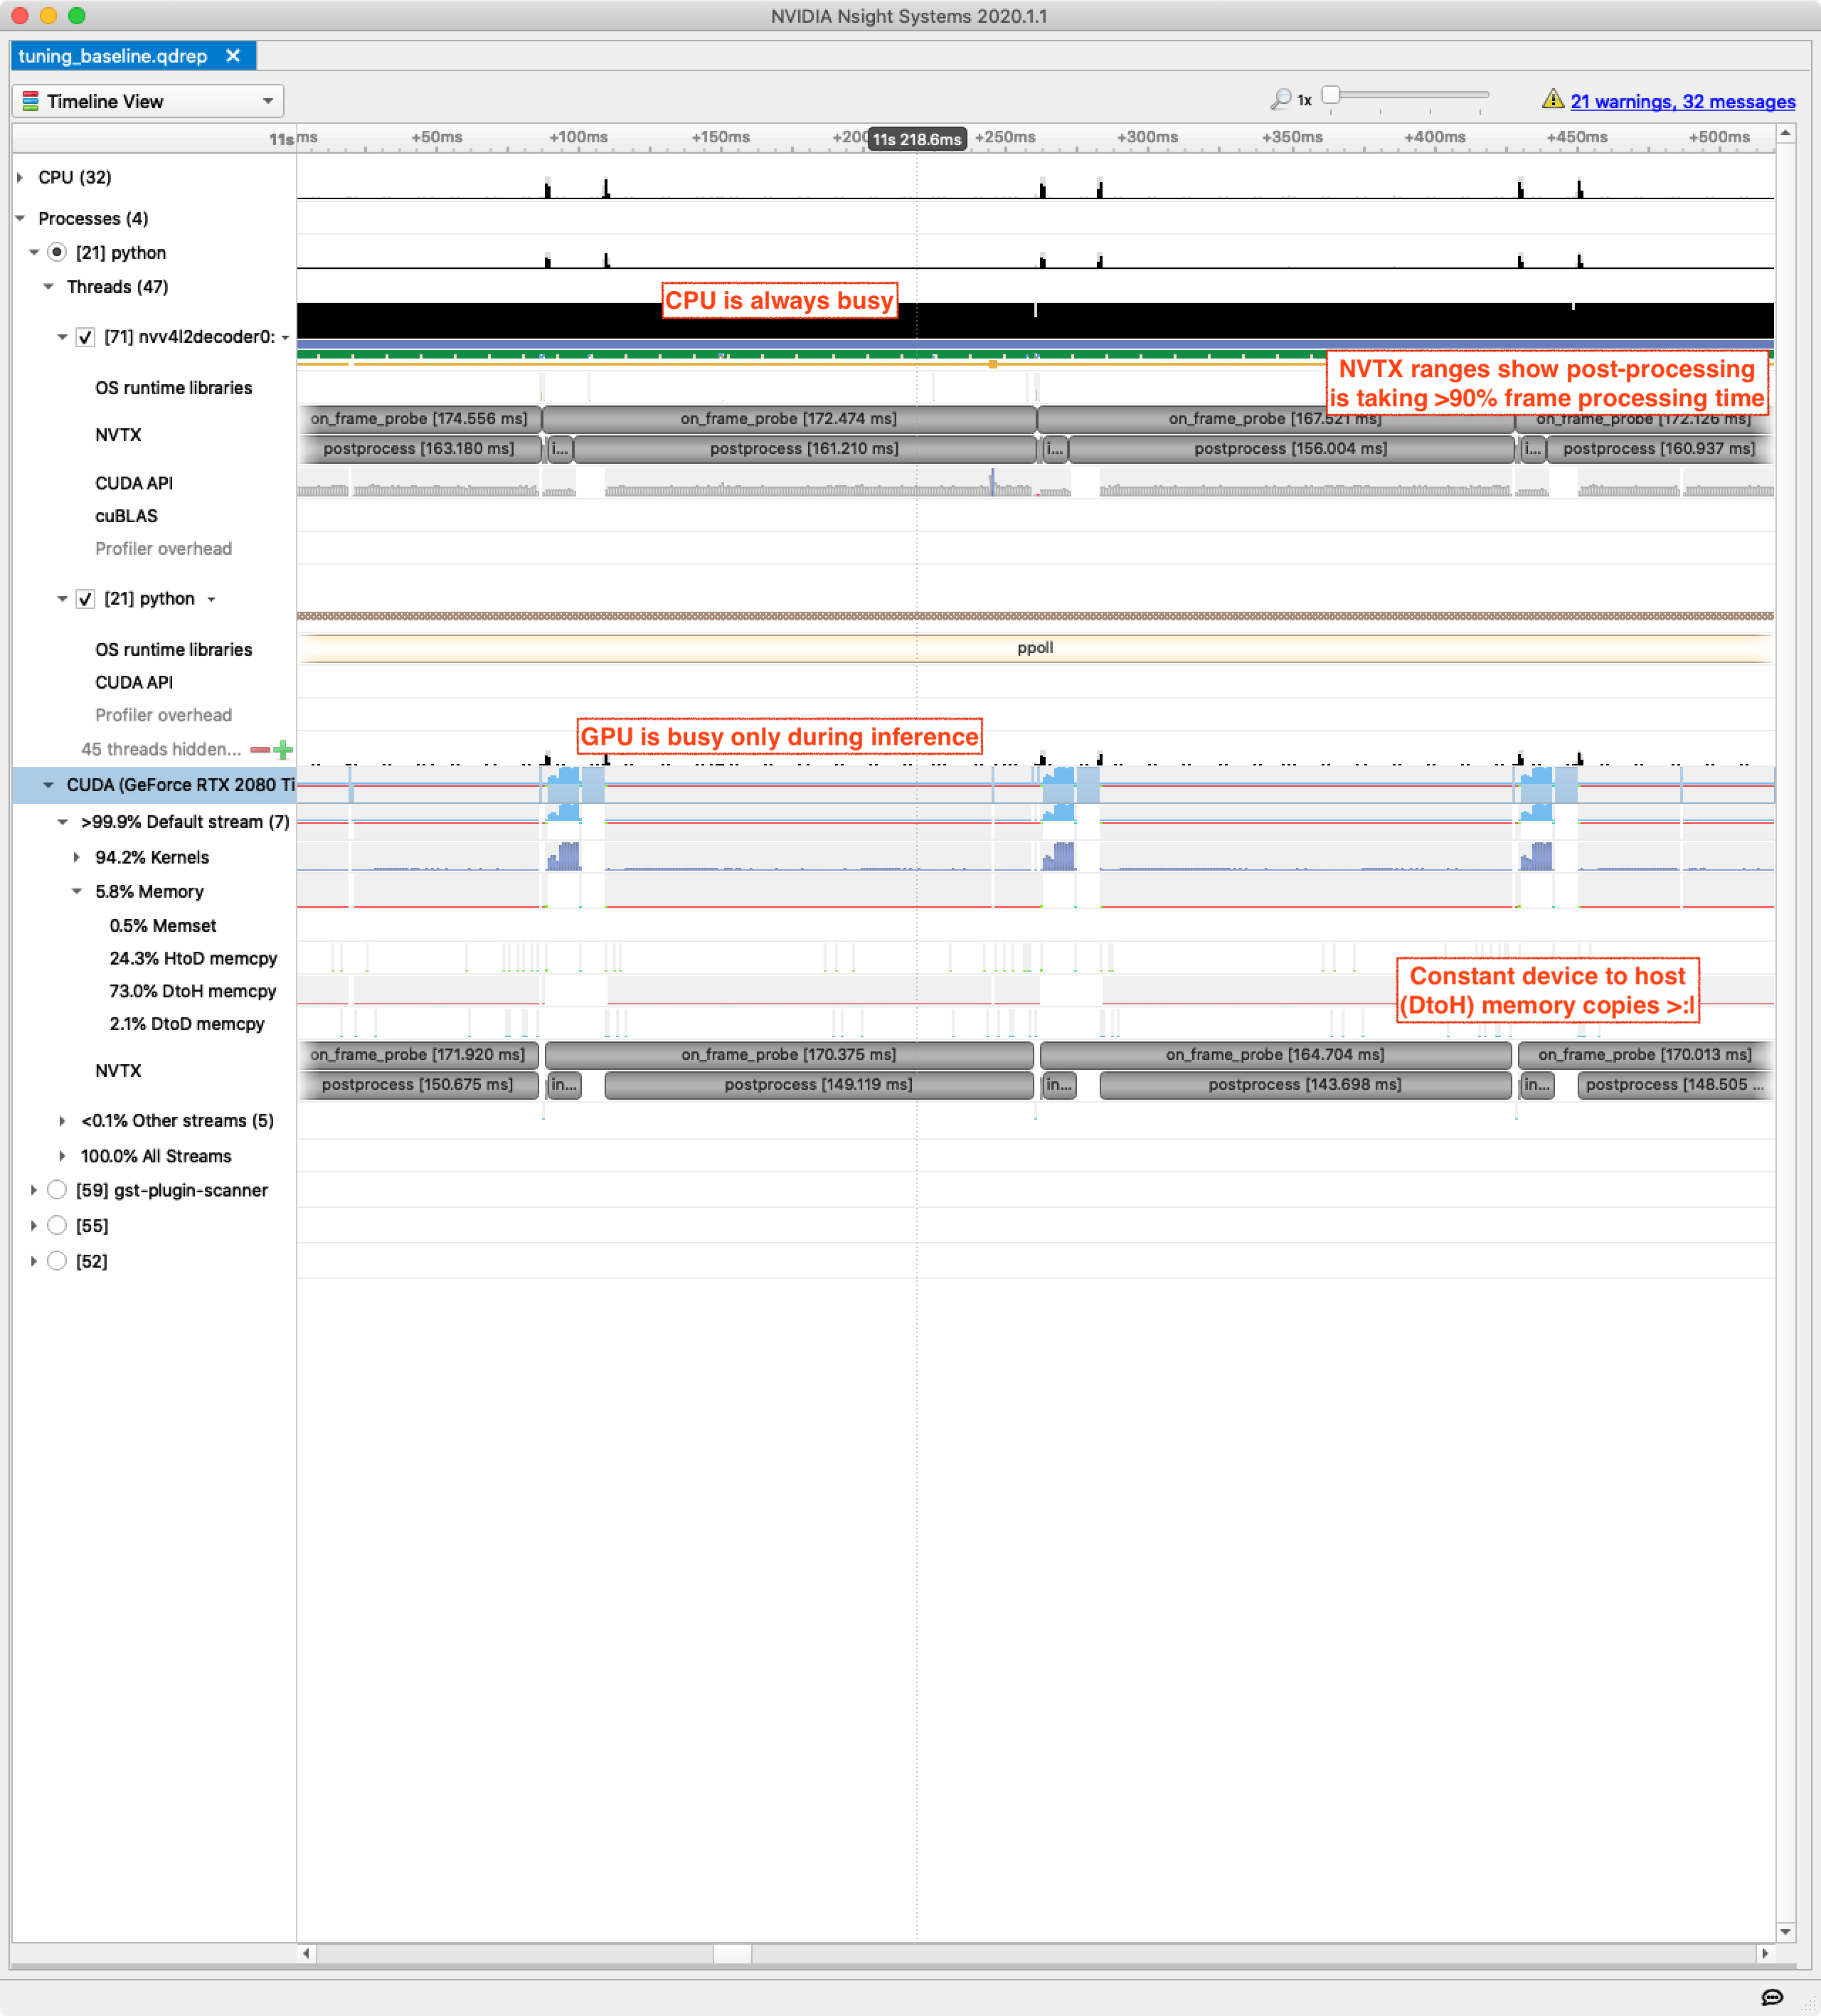
Postprocessing taking >90% of elapsed time is a disaster — from a high-level this is the first thing to fix, but what is causing it?
During postprocessing we can see that CPU usage is very high, GPU usage is very low (but not 0%), and there are constant memory transfers from device to host. The most likely scenario is that the postprocessing is largely being done on CPU, but it is constantly pulling small pieces of data from the GPU required for the processing.
Let’s drill in to show activity for a couple of milliseconds:

Looking at the CUDA API timeline, we can see a lot of memory transfers and the green synchronization around them. The CUDA synchronization calls are further evidence that this postprocessing is being done partly on CPU and partly on GPU and is synchronized in a very fine-grained fashion. Let’s fix it.
Here is the baseline postprocessing code:
def postprocess(locs, labels):
    with nvtx_range('postprocess'):
        results_batch = ssd_utils.decode_results((locs, labels))
        results_batch = [ssd_utils.pick_best(results, detection_threshold) for results in results_batch]
        for bboxes, classes, scores in results_batch:
            if scores.shape[0] > 0:
                print(bboxes, classes, scores)
At the point of the highlighted line, the arguments locs and labels are tensors on the GPU (these are returned directly from the SSD300 inference). The decode_results code is accessing the tensors elementwise and doing work on CPU, causing the repeated fine-grained requests for data to be sent from GPU to system memory.
The initial fix is super simple — we will send these entire tensors to system memory in a single operation.
Stage 1: Fix Fine-Grained Synchronization #
| Code | Nsight Systems Trace | Gstreamer Pipeline |
|---|---|---|
| tuning_postprocess_1.py | tuning_postprocess_1.qdrep | tuning_postprocess_1.pipeline.dot.png |
The updated code looks like this:
def postprocess(locs, labels):
    with nvtx_range('postprocess'):
        results_batch = ssd_utils.decode_results((locs.cpu(), labels.cpu()))
        results_batch = [ssd_utils.pick_best(results, detection_threshold) for results in results_batch]
        for bboxes, classes, scores in results_batch:
            if scores.shape[0] > 0:
                print(bboxes, classes, scores)
Running the baseline code without tracing enabled gave us 9 FPS throughput and this improved code runs at just under 16 FPS. A 78% improvement is not bad for just typing .cpu() twice. This leads to a good rule of thumb for GPU programming:
Avoid Fine-Grained Synchronization
Your host (CPU) code is dispatching work to an incredibly powerful co-processor which can do complex work asynchronously. However, host/device communication latency and synchronization are costly — try to dispatch large chunks of work and avoid fine-grained memory transfers.
The updated Nsight Systems view showing processing for two frames (below) has a clear difference. Instead of a constant stream of small transfers from device to host we now see one large transfer at the start of the postprocessing phase.
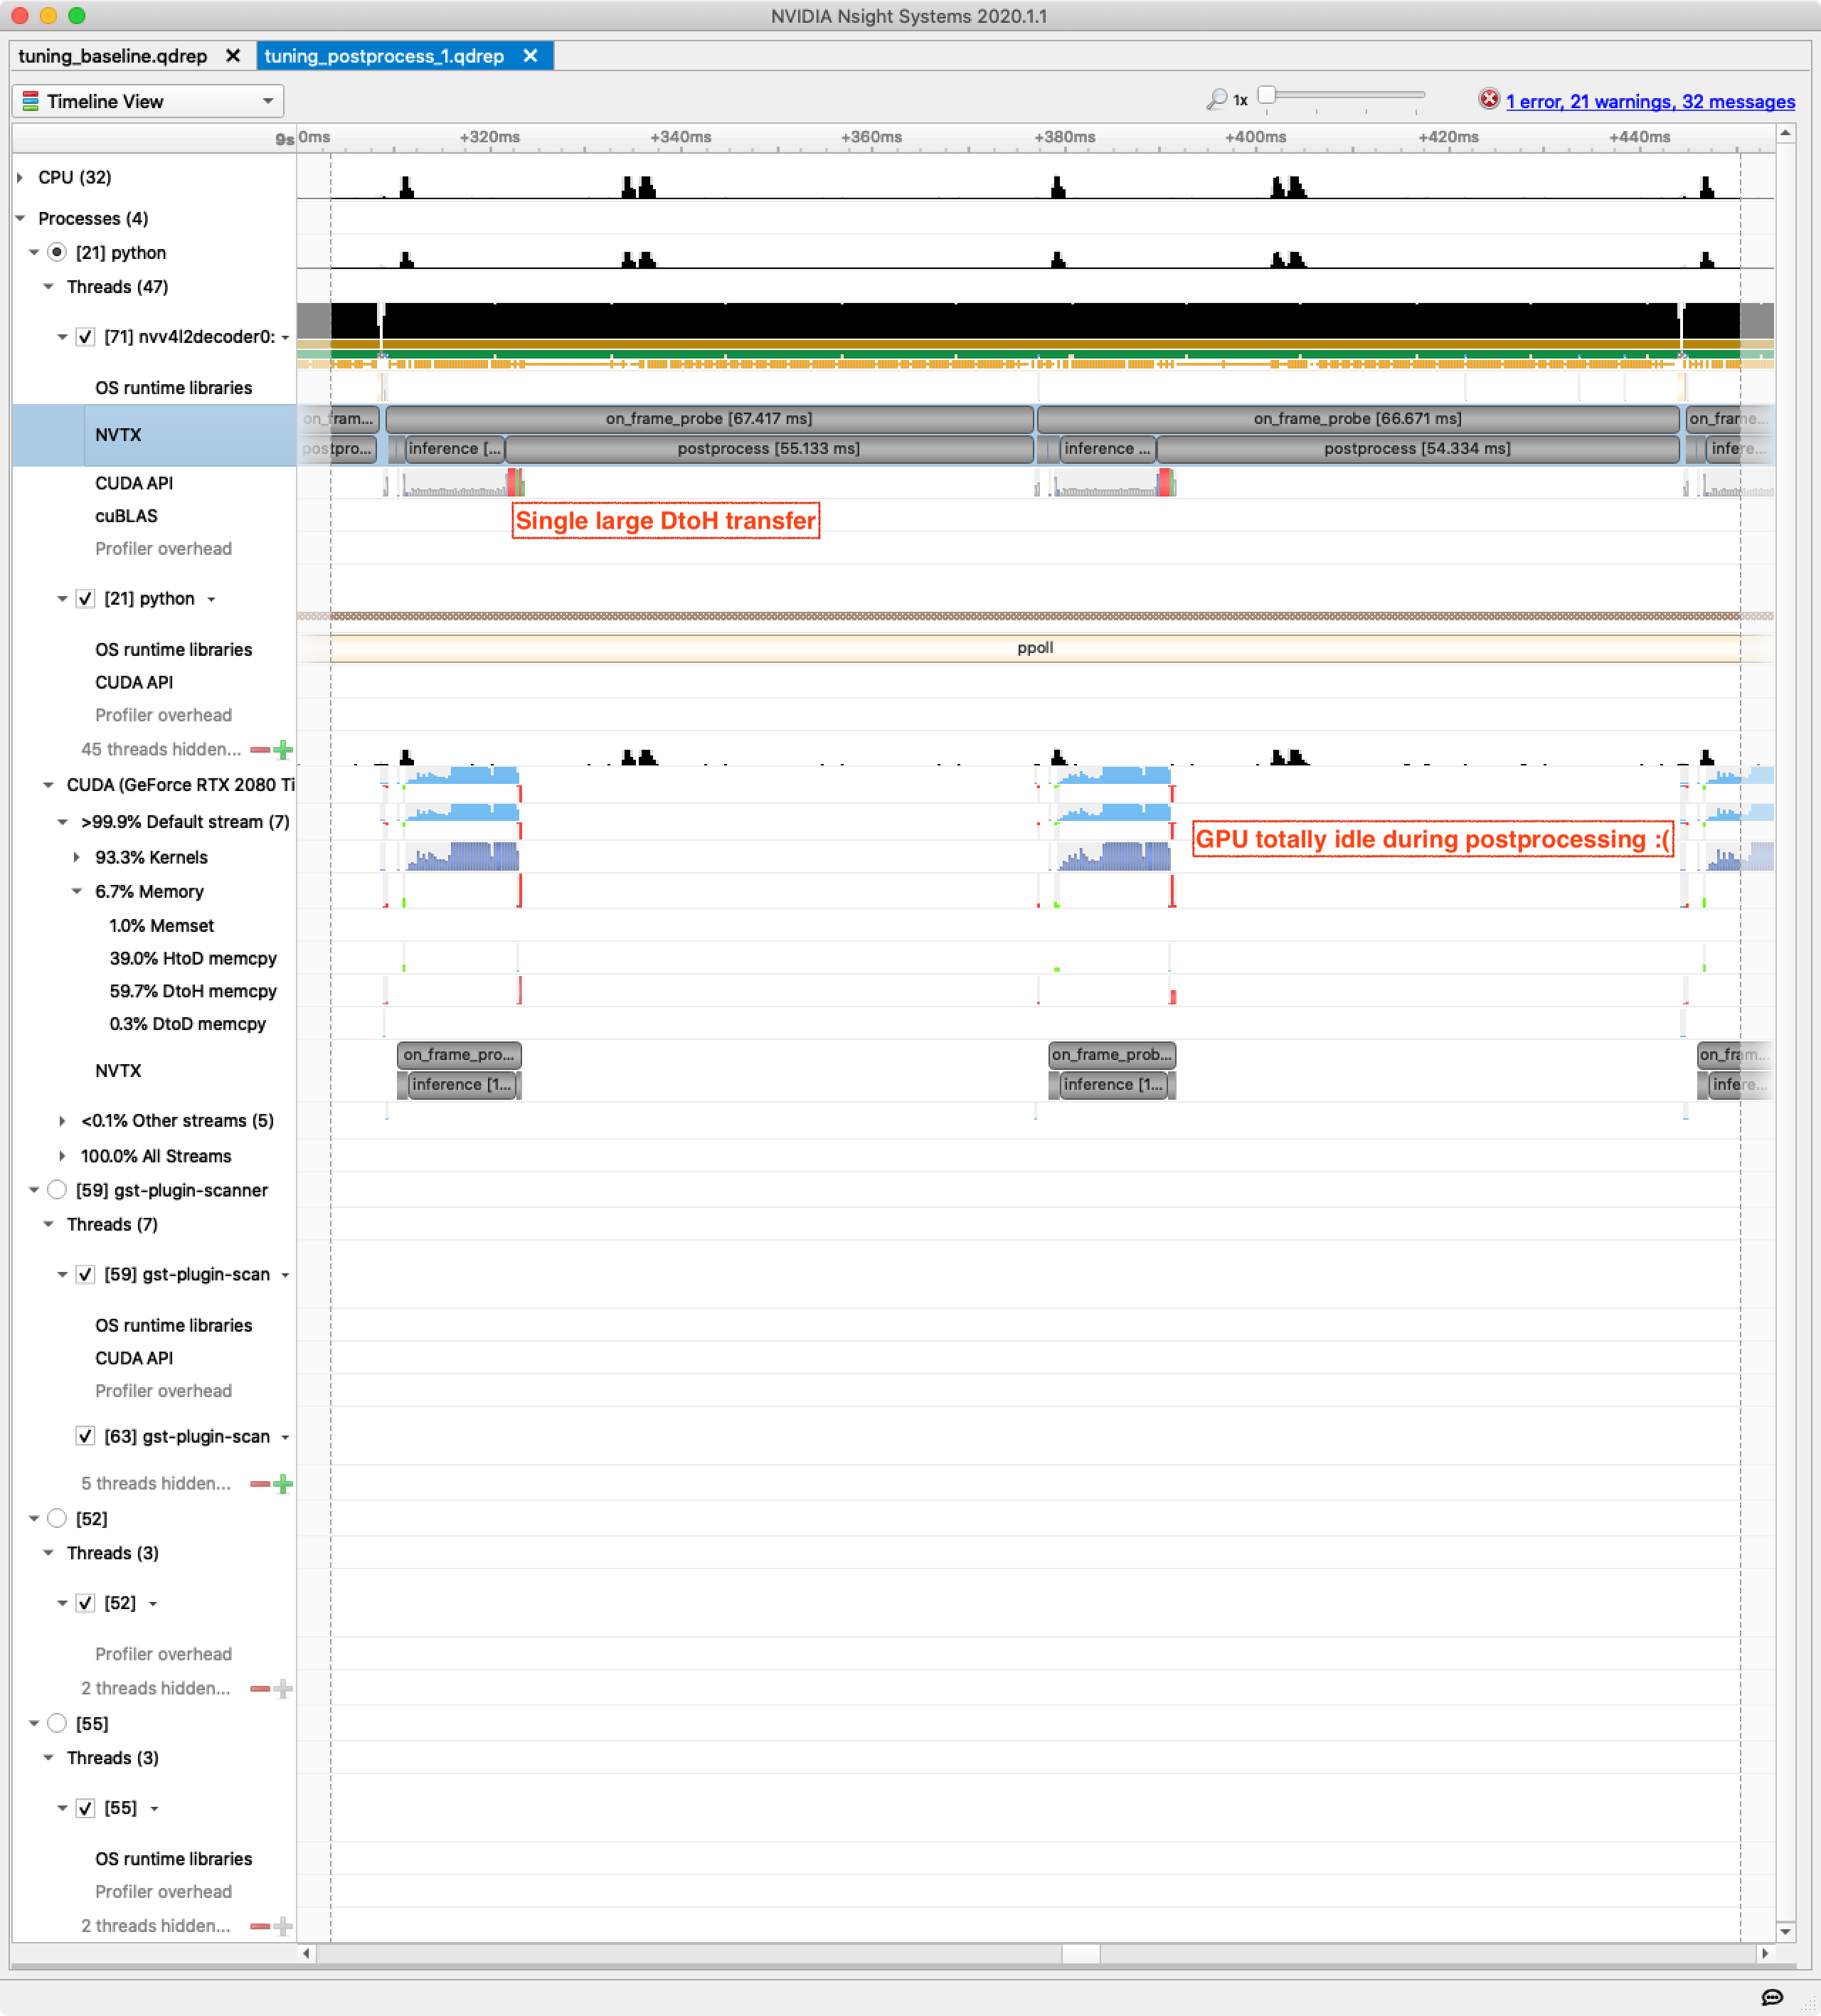
Postprocessing still takes over 80% of frame-processing time and the process is still heavily CPU bottlenecked. What if we could do the postprocessing using the GPU?
Stage 2: Postprocessing on GPU #
| Code | Nsight Systems Trace | Gstreamer Pipeline |
|---|---|---|
| tuning_postprocess_2.py | tuning_postprocess_2.qdrep | tuning_postprocess_2.pipeline.dot.png |
Turning preprocessing and postprocessing into heavily vectorized GPU code can be tricky for some models but is one of the highest-impact performance improvements you can make.
I’ve added around 100 lines of code to do this for the SSD model — here is the new top-level postprocessing code:
def postprocess(locs, labels):
    with nvtx_range('postprocess'):
        locs, probs = xywh_to_xyxy(locs, labels)

        # flatten batch and classes
        batch_dim, box_dim, class_dim = probs.size()
        flat_locs = locs.reshape(-1, 4).repeat_interleave(class_dim, dim=0)
        flat_probs = probs.view(-1)
        class_indexes = torch.arange(class_dim, device=device).repeat(batch_dim * box_dim)
        image_indexes = (torch.ones(box_dim * class_dim, device=device) * torch.arange(1, batch_dim + 1, device=device).unsqueeze(-1)).view(-1)

        # only do NMS on detections over threshold, and ignore background (0)
        threshold_mask = (flat_probs > detection_threshold) & (class_indexes > 0)
        flat_locs = flat_locs[threshold_mask]
        flat_probs = flat_probs[threshold_mask]
        class_indexes = class_indexes[threshold_mask]
        image_indexes = image_indexes[threshold_mask]

        nms_mask = torchvision.ops.boxes.batched_nms(
            flat_locs,
            flat_probs,
            class_indexes * image_indexes,
            iou_threshold=0.7
        )

        bboxes = flat_locs[nms_mask].cpu()
        probs = flat_probs[nms_mask].cpu()
        class_indexes = class_indexes[nms_mask].cpu()
        if bboxes.size(0) > 0:
            print(bboxes, class_indexes, probs)
If the above code is hard to understand that’s awesome, because it took me quite some effort to learn how to do this.
Going through the code in detail is beyond the scope of this article, but the general flow is:
- Flatten almost all tensor dimensions.
- Apply probability thresholding and ignore the background class with a mask.
- Do a batched non-max suppression (NMS) on all detections, using indices to ensure the NMS isn’t applied across classes or images. Importantly, this is all happening with tensors and operations on the GPU.
Now let’s see the new Nsight Systems output zoomed to the frame level:
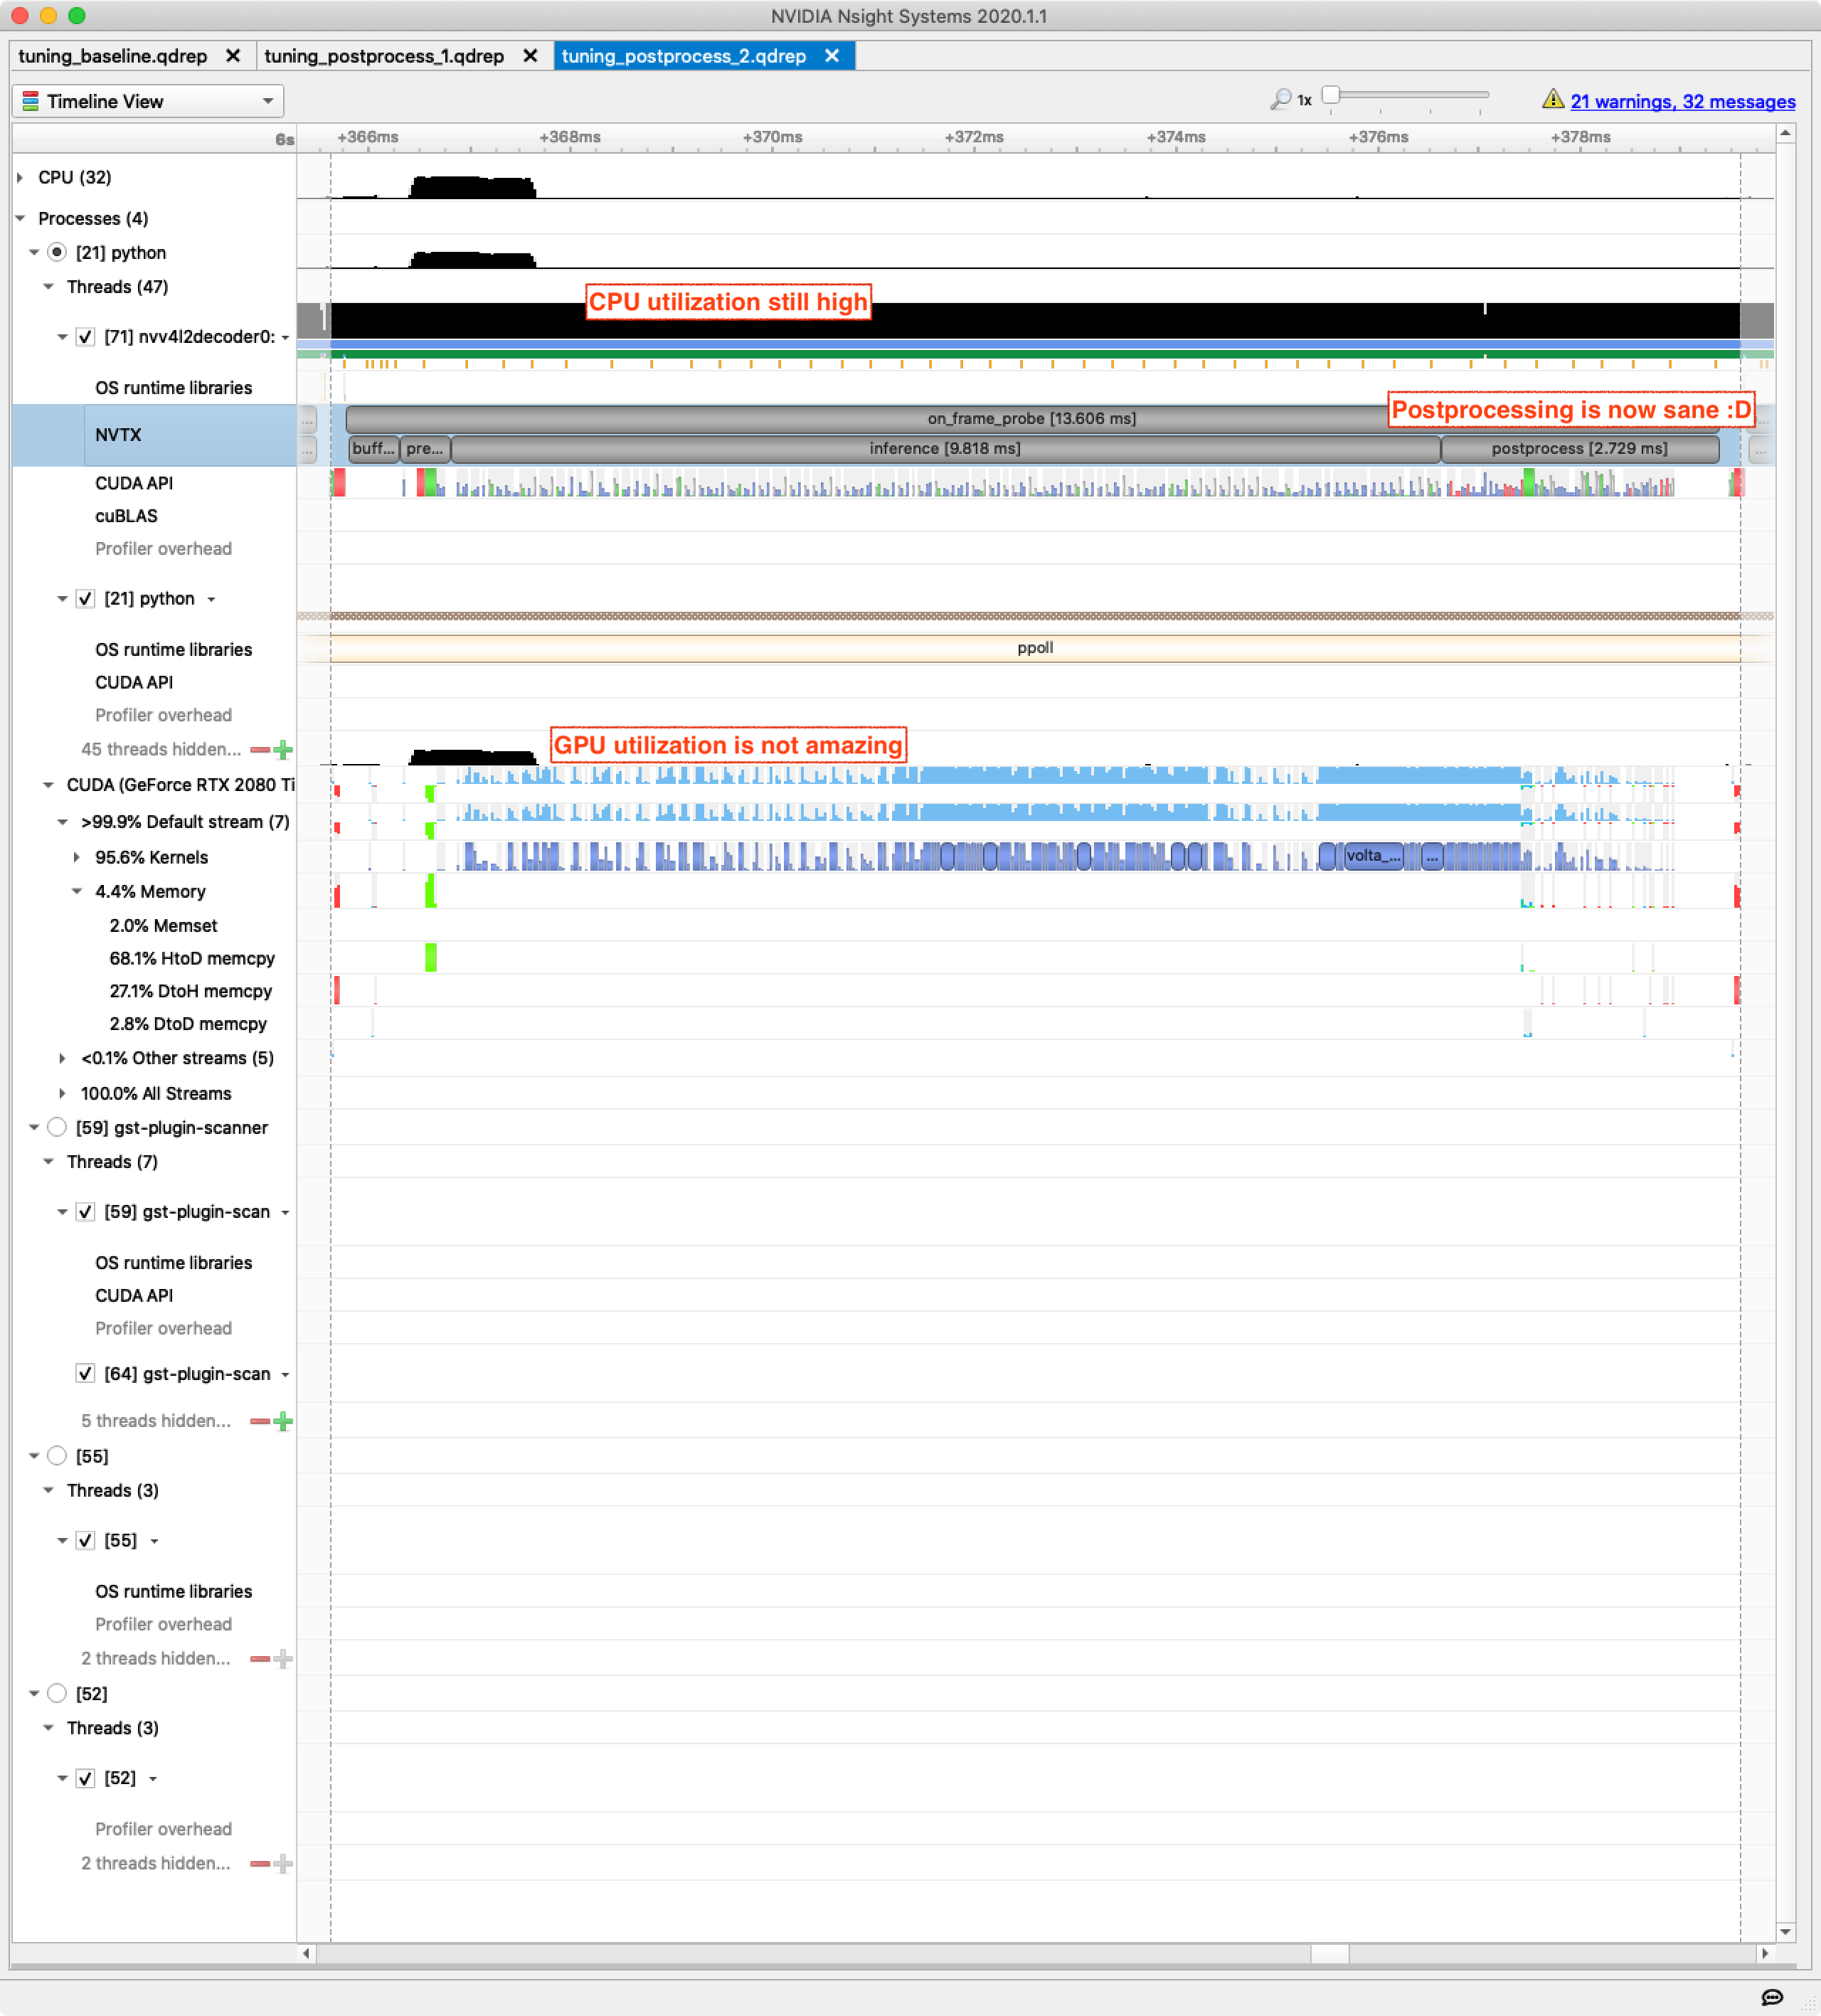
Postprocessing for a single frame has gone from around 54 ms on CPU to under 3 ms on the GPU. Measuring throughput without tracing overhead we are now getting around 80 FPS, up from 16 FPS with postprocessing on CPU.
That’s a 400% improvement to frame-processing throughput and shows the ridiculous power of modern GPUs. Another rule of thumb:
Do Heavy Numerical Work on the GPU
If it is possible to vectorize code and dispatch large chunks of numerical work to the GPU, it will almost always be worth it. Libraries such as Pytorch, CuPy and cuDF allow us to access 80% of the benefit of writing custom CUDA code from within Python.
Stage 3: Batch Processing #
| Code | Nsight Systems Trace | Gstreamer Pipeline |
|---|---|---|
| tuning_batch.py | tuning_batch.qdrep | tuning_batch.pipeline.dot.png |
Looking at the above trace output the most tantalizing observation is that GPU utilization is quite low during the inference phase. This inference is a series of CUDA kernels submitted by the host (CPU) to the device (GPU) — the GPU is doing all the real work but still the host cannot keep up.
One very easy way to increase the amount of work sent to the GPU is by sending multiple frames through the neural network at once — batch processing.
In this simplistic implementation only the top-level per-frame code changes. Frame tensors are accumulated into a list and when the list reaches the batch_size we do the preprocessing, inference and postprocessing on the entire batch at once. I’ve also changed the NVTX ranges so we can track the accumulation of the batch.
def on_frame_probe(pad, info):
    global start_time, frames_processed
    start_time = start_time or time.time()

    global image_batch

    if not image_batch:
        torch.cuda.nvtx.range_push('batch')
        torch.cuda.nvtx.range_push('create_batch')

    buf = info.get_buffer()
    print(f'[{buf.pts / Gst.SECOND:6.2f}]')

    image_tensor = buffer_to_image_tensor(buf, pad.get_current_caps())
    image_batch.append(image_tensor)

    if len(image_batch) < batch_size:
        return Gst.PadProbeReturn.OK

    torch.cuda.nvtx.range_pop() # create_batch

    image_batch = preprocess(torch.stack(image_batch))
    frames_processed += image_batch.size(0)

    with torch.no_grad():
        with nvtx_range('inference'):
            locs, labels = detector(image_batch)
            image_batch = []
        postprocess(locs, labels)

    torch.cuda.nvtx.range_pop() # batch
    return Gst.PadProbeReturn.OK
With this simple change (using a batch-size of 4) throughput jumps from 80 FPS to around 125 FPS.
Let’s check Nsight Systems:
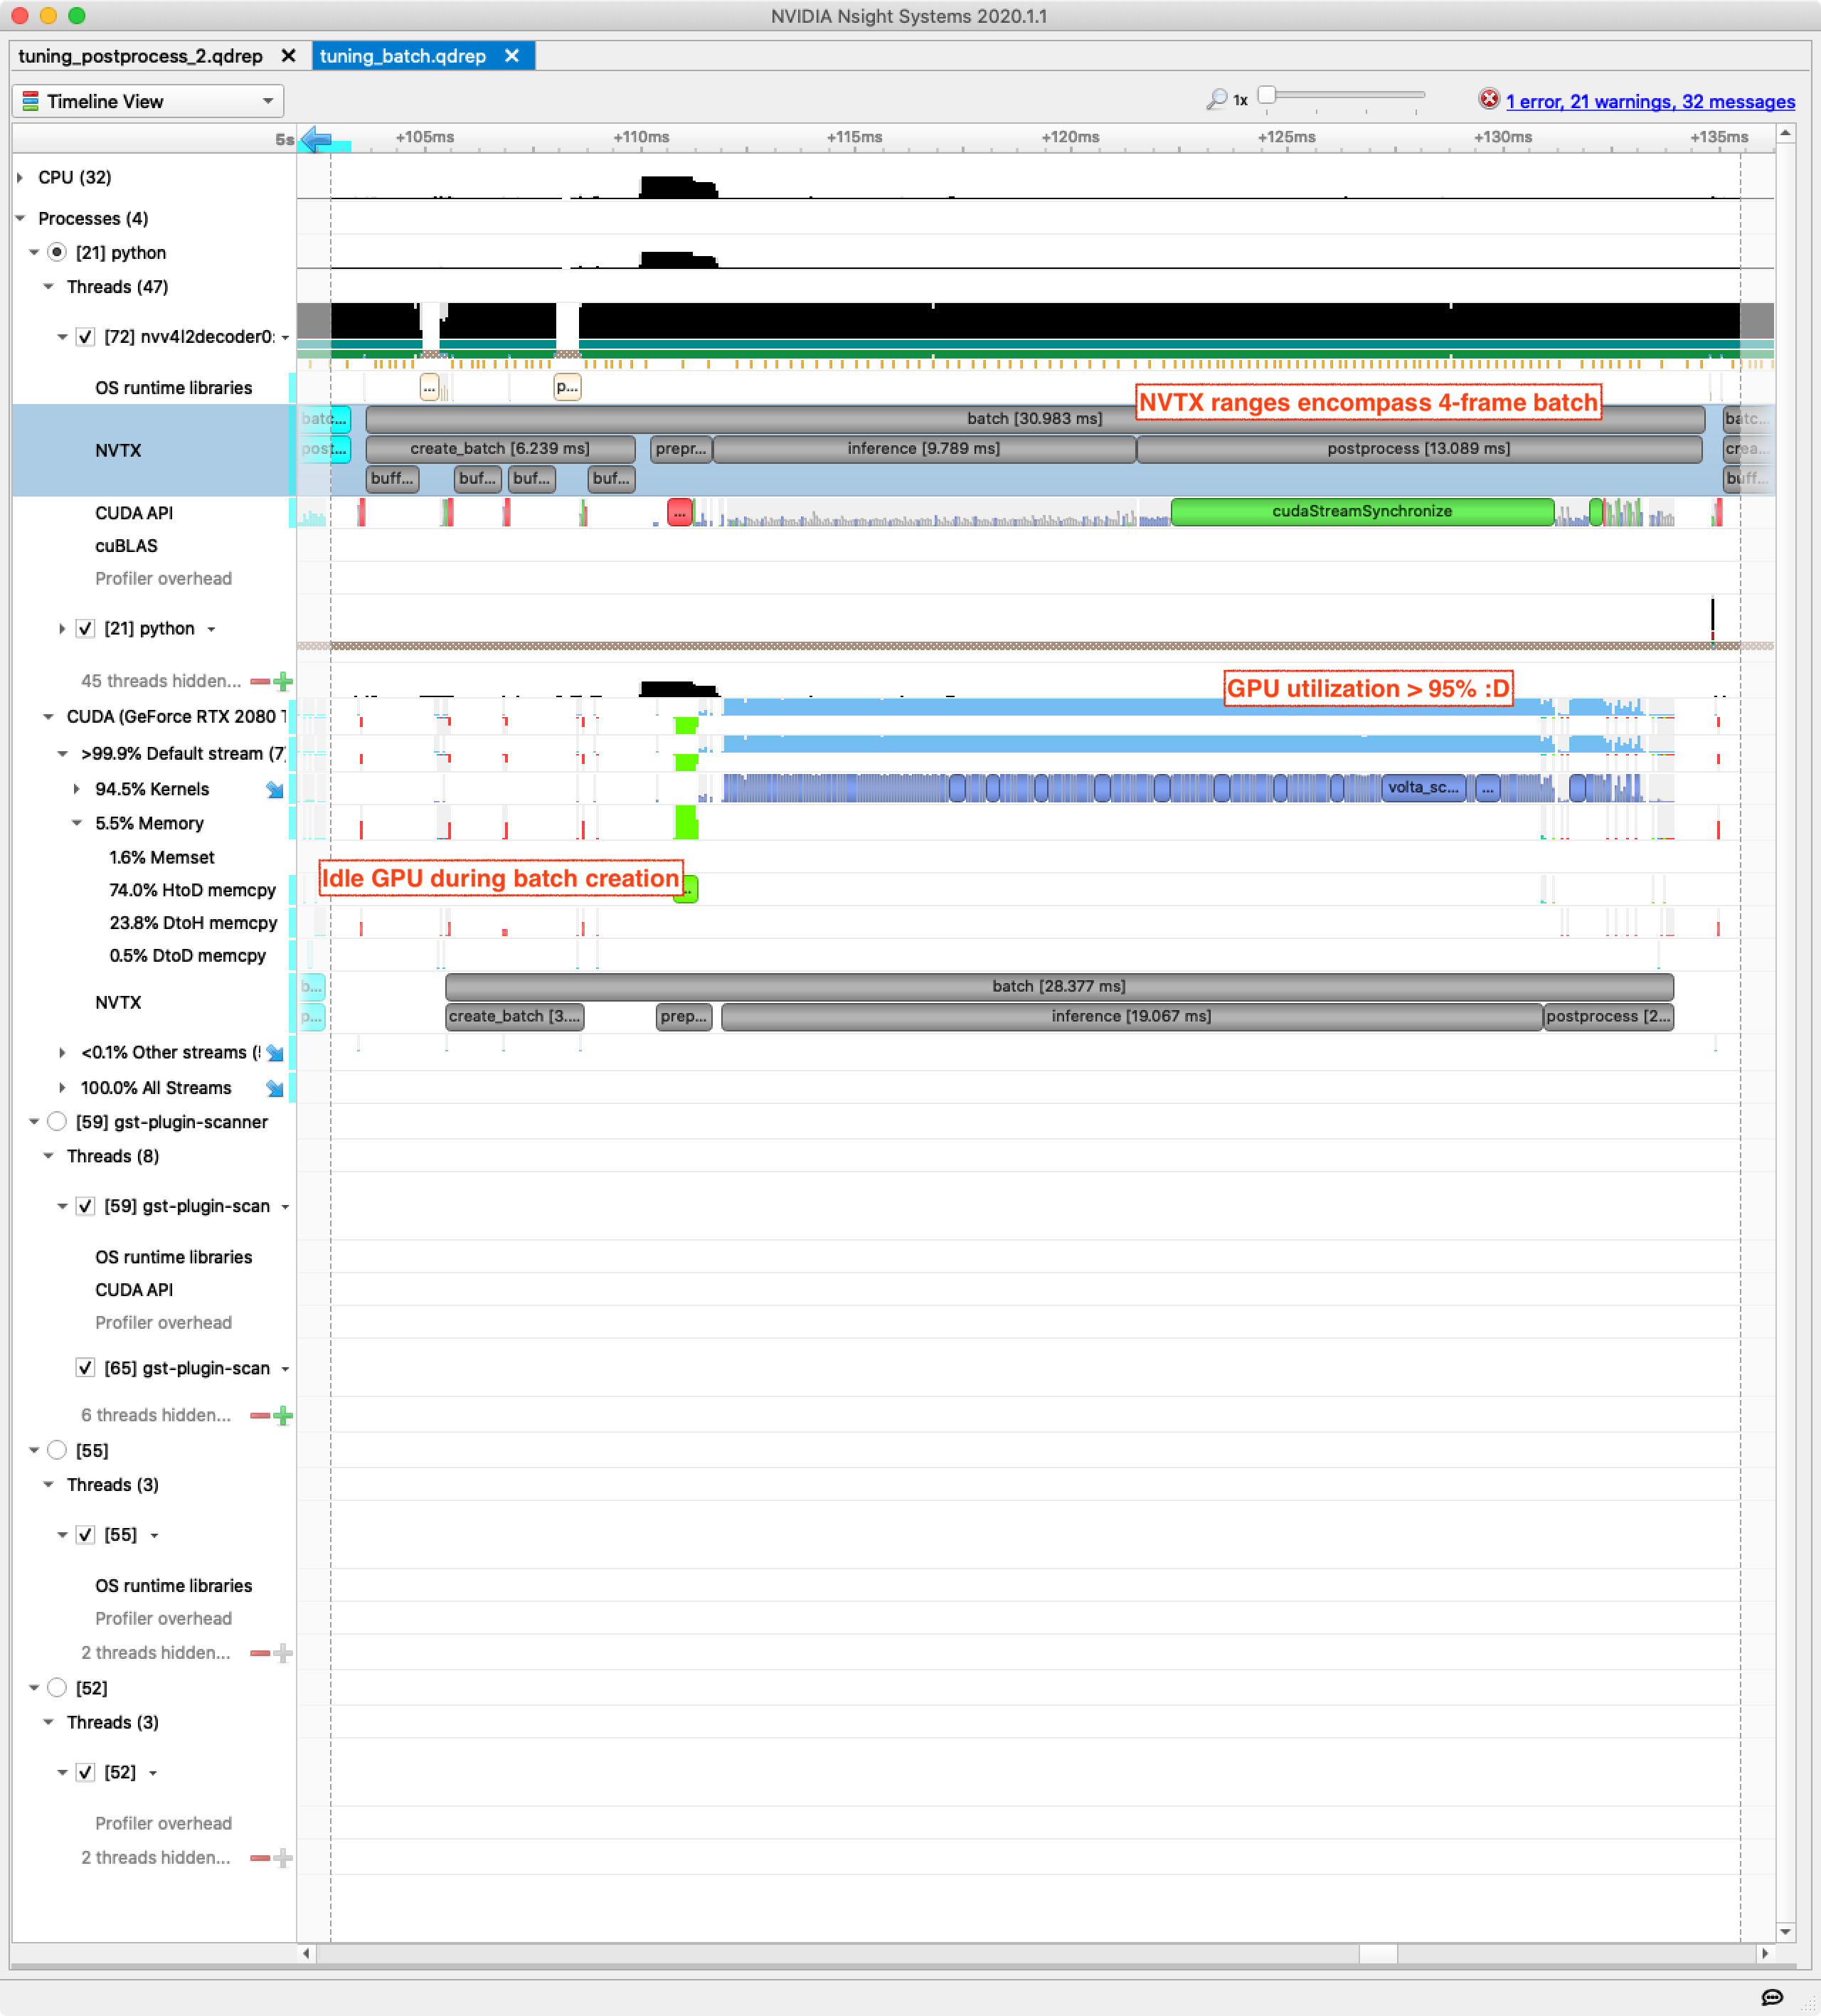
Inference time has approximately doubled, which is a good deal since we’re processing 4x more frames. This gives a rule of thumb which is a special case of the earlier “send large chunks of work” idea, but it deserves to be highlighted:
Do Batched Inference Where Possible
Send batched inputs for preprocessing, inference and postprocessing unless you really can’t afford the trade-off for increased latency. This is one of the easiest ways to increase GPU utilization — provided you’ve already implemented preprocessing and postprocessing to handle batches (which you should).
The GPU is now fully utilized during inference (finally) but is entirely idle while we accumulate frames into the batch. We will fix that soon but first we will enable another quick win — half-precision inference using the tensor cores in Volta, Turing, and later hardware from Nvidia.
Stage 4: Half-Precision Inference on Tensor Cores #
| Code | Nsight Systems Trace | Gstreamer Pipeline |
|---|---|---|
| tuning_fp16.py | tuning_fp16.qdrep | tuning_fp16.pipeline.dot.png |
One of the reasons I picked Nvidia’s SSD300 model for this article is because Nvidia provides both float32 and half-precision float16 pre-trained versions. Prior to Pytorch 1.6 the best way to train a mixed precision model was to use Nvidia’s Apex library which makes it easy to store and train model weights with float16 precision while accumulating gradients in float32 tensors. In Pytorch >= 1.6 this support is built-in.
For our purposes the only code change required is to 1) load a different version of the model from Torch Hub, and 2) ensure tensors sent for inference are float16 not float32. I’ve also increased batch-size from 4 to 8 in this iteration in order to maintain >95% GPU utilisation during inference.
When run without tracing overhead throughput has improved from 125 FPS to 185 FPS. An almost effortless ~50% increase in throughput thanks to the tensor cores.
Use Tensor Cores Where Possible
More generally — know and take advantage of the special capabilities of your hardware. Volta gave us faster fp16 multiply-add, Turing gave us int4 and int8 for quantized inference, and Ampere brings accelerated sparse compute as well as tf32 and bfloat16 capabilities.

This Nsight Systems per-batch view looks remarkably similar to the previous one. Batch processing time has gone from ~30 ms to ~40 ms but we’re now processing 8 frames per batch rather than 4.
Looking more closely we can see the inference and postprocessing times have barely changed while doubling the size of the batch. The batch creation phase is now very obviously limiting our throughput — the GPU is essentially idle and we have some large host/device memory transfers. It’s time to fix that.
Stage 5: Decode Video Direct to Device #
| Code | Nsight Systems Trace | Gstreamer Pipeline |
|---|---|---|
| tuning_dtod.py | tuning_dtod.qdrep | tuning_dtod.pipeline.dot.png |
Those large host/device memory transfers are due to the inability of Gstreamer to directly give us Pytorch tensors sitting on the GPU ready for processing. If you look closely at the Gstreamer pipeline you’ll see that the nvv4l2decoder element is passing video/x-raw(memory:NVMM) buffers downstream — this tells us that the video frames are being decoded using the GPU. The pipeline then explicitly transfers this GPU memory to host using the nvvideoconvert element (note the lack of (memory:NVMM) on the highlighted line):
pipeline = Gst.parse_launch(f'''
    filesrc location=media/in.mp4 num-buffers=256 !
    decodebin !
    nvvideoconvert !
    video/x-raw,format={frame_format} !
    fakesink name=s
''')
This allows Gstreamer to put the decoded frame contents into a regular (host) buffer in the pipeline and we then transfer the buffer back onto the GPU during preprocessing. This is a huge waste of time, and it would be a lot faster if the frames could stay on the GPU end to end.
What if we just keep the memory on GPU throughout the pipeline? It would look like this:
pipeline = Gst.parse_launch(f'''
    filesrc location=media/in.mp4 num-buffers=256 !
    decodebin !
    nvvideoconvert !
    video/x-raw(memory:NVMM),format={frame_format} !
    fakesink name=s
''')
Our frame probe has been added to the buffer sink of the final (fakesink) element so it will now be called with buffers that represent memory on the GPU. But what does such a buffer look like? Well, instead of the buffer containing the pixels of the decoded frame the buffer contains a C structure — an NvBufSurface.
The NvBufSurface can be used to find out the GPU memory address of the decoded buffer as well as frame characteristics like size and pixel format. These details allow us to copy this GPU memory directly into a Pytorch tensor. This is a device-to-device memory transfer and will be extremely fast.
The old, boring buffer_to_image_tensor code looks like this:
def buffer_to_image_tensor(buf, caps):
    with nvtx_range('buffer_to_image_tensor'):
        caps_structure = caps.get_structure(0)
        height, width = caps_structure.get_value('height'), caps_structure.get_value('width')

        is_mapped, map_info = buf.map(Gst.MapFlags.READ)
        if is_mapped:
            try:
                image_array = np.ndarray(
                    (height, width, pixel_bytes),
                    dtype=np.uint8,
                    buffer=map_info.data
                )
                return torch.from_numpy(
                    image_array[:,:,:3].copy() # RGBA -> RGB, and extend lifetime beyond subsequent unmap
                )
            finally:
                buf.unmap(map_info)
We need to change this to interpret the Gstreamer buffer as an NvBufSurface C struct. Nvidia provides a Python library for dealing with these structures called nvds but it has two major problems:
- It tends to be available only for woefully old versions of Python — annoying.
- It doesn’t provide a way to avoid the GPU-to-Host buffer copy — useless for our purposes.
I’ve created a minimal ctypes-based module which interacts with libnvbufsurface.so and does what we want: ghetto_nvds.py
The updated high-level buffer_to_image_tensor code takes a few steps to do one thing — copy the NvBufSurface to a matching NvBufSurface where the destination data pointer points to a pre-allocated Pytorch tensor.
def buffer_to_image_tensor(buf, caps):
    with nvtx_range('buffer_to_image_tensor'):
        caps_structure = caps.get_structure(0)
        height, width = caps_structure.get_value('height'), caps_structure.get_value('width')

        is_mapped, map_info = buf.map(Gst.MapFlags.READ)
        if is_mapped:
            try:
                source_surface = ghetto_nvds.NvBufSurface(map_info)
                torch_surface = ghetto_nvds.NvBufSurface(map_info)

                dest_tensor = torch.zeros(
                    (torch_surface.surfaceList[0].height, torch_surface.surfaceList[0].width, 4),
                    dtype=torch.uint8,
                    device=device
                )

                torch_surface.struct_copy_from(source_surface)
                assert(source_surface.numFilled == 1)
                assert(source_surface.surfaceList[0].colorFormat == 19) # RGBA

                # make torch_surface map to dest_tensor memory
                torch_surface.surfaceList[0].dataPtr = dest_tensor.data_ptr()

                # copy decoded GPU buffer (source_surface) into Pytorch tensor (torch_surface -> dest_tensor)
                torch_surface.mem_copy_from(source_surface)
            finally:
                buf.unmap(map_info)

            return dest_tensor[:, :, :3]
The Nsight Systems view makes the value of this change clear:
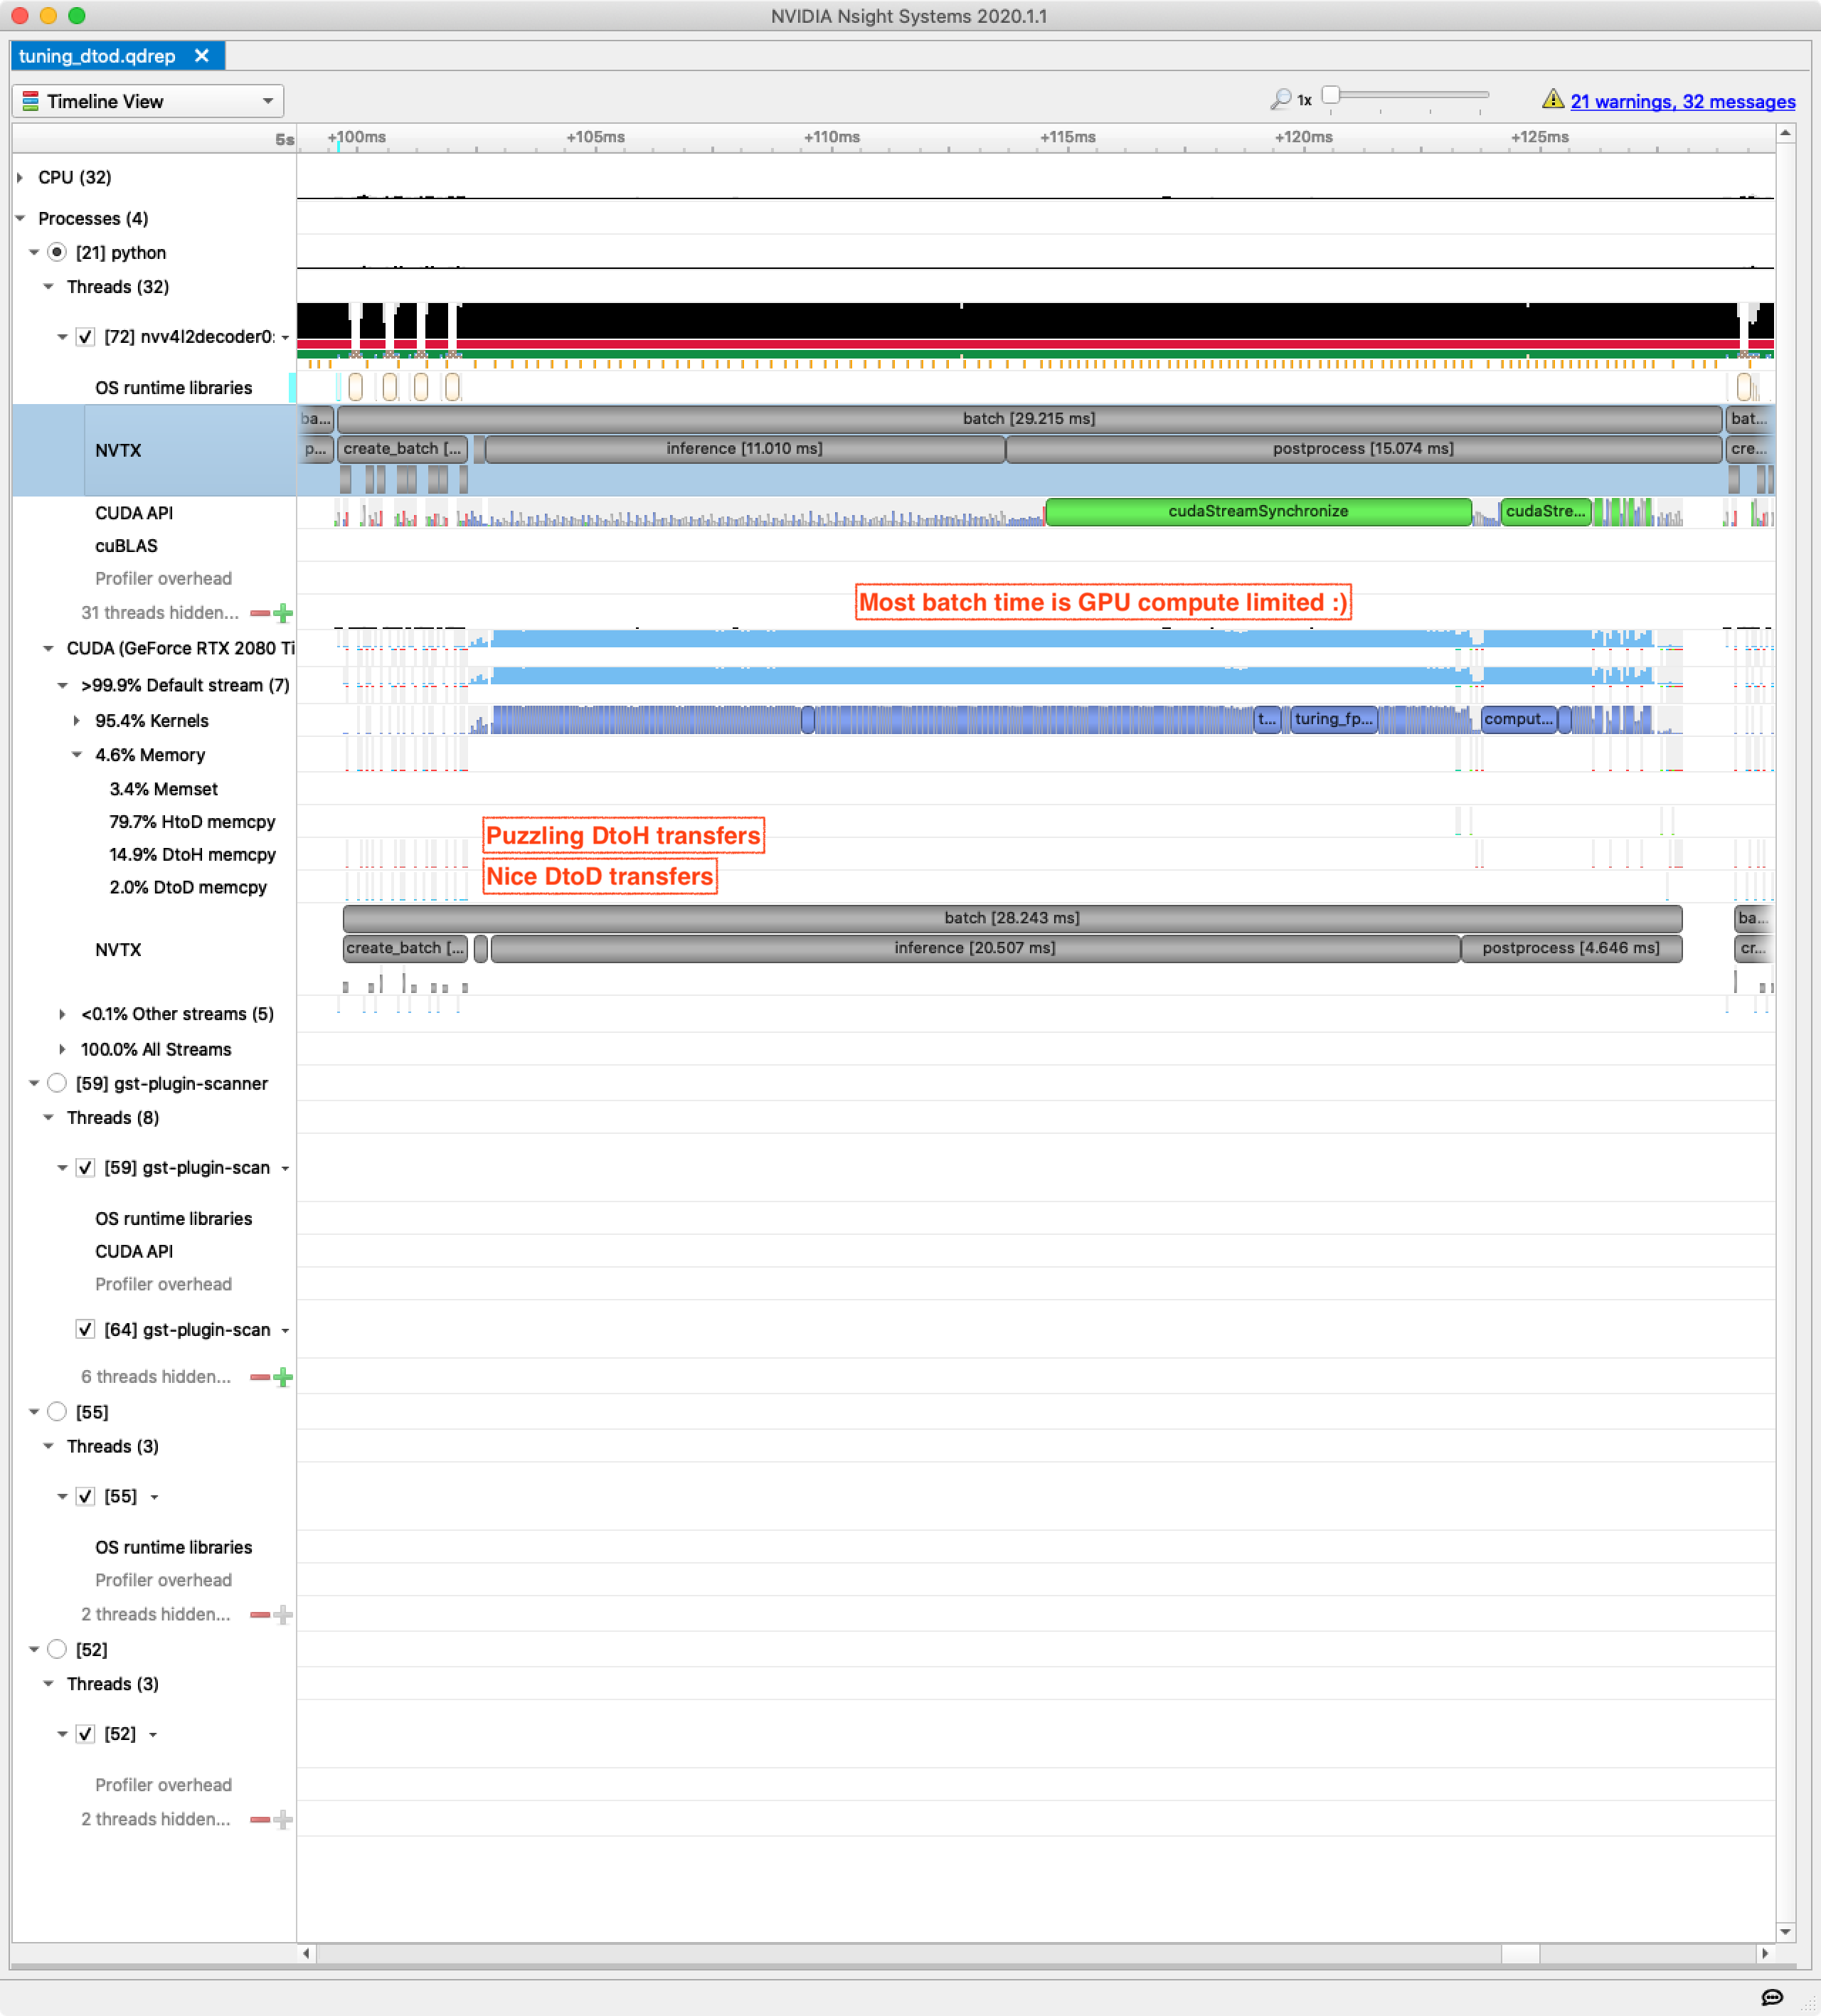
Previously, batch creation and preprocessing were around 30% of end-to-end batch processing time and with this change they drop to around 10%. Throughput is now up to 235 FPS from 185 FPS.
Aspire to an End-to-End GPU Pipeline
Due to the costs of synchronization and host/device communciation latency a fully end-to-end GPU pipeline is a lot better than an 80% on-GPU pipeline. Try to move all elements of your data processing pipeline onto the GPU, or at the very least do not frequently alternate pipeline stages between CPU and GPU.
Nsight Systems still shows some puzzling device-to-host memory transfers during batch creation but drilling in reveals these are single byte transfers with no synchronization required — not a problem for now.
Stage 6: Concurrency #
| Code | Nsight Systems Trace | Gstreamer Pipeline |
|---|---|---|
| tuning_concurrency.py | tuning_concurrency.qdrep | tuning_concurrency.pipeline.dot.png |
So far our pipeline is highly serial at the batch-component level — postprocessing follows inference, which follows preprocessing, which follows batch creation. It looks something like this:

In order to get to full utilization while staying serial every component would need to individually reach full utilization. This would be a lot of work.
One shortcut is to introduce some concurrency so that multiple threads of execution with suboptimal utilization will add up to higher utilization at the system level. Here I will introduce concurrency at multiple levels in a single change, but each of these steps has been tested incrementally so as to avoid madness.
The changes:
- Use system threads to separate:
- Batch creation (which still has low GPU utilization) and,
- Preprocessing, inference and postprocessing.
- Put all inference operations on a per-thread CUDA stream.
- Put frame batch creation on a dedicated CUDA stream.
- Use two GPUs for the preprocessing, inference and postprocessing.
With multiple devices and CUDA streams the processing looks like this:

The results are pretty great. Before adding these several levels of concurrency we were at 235 FPS. Now, with a single GPU we are seeing 350 FPS and 650 FPS running on two GPUs (with performance tracing disabled).
Use Host Concurrency Wisely
- Host/CPU concurrency can be essential to enqueue sufficient work to keep a powerful GPU busy.
- However, host concurrency introduces complex between-thread interactions making debugging and tracing much harder (see below).
For once Nsight Systems doesn’t immediately point the way forward, though it shows our utilization is not maximised:
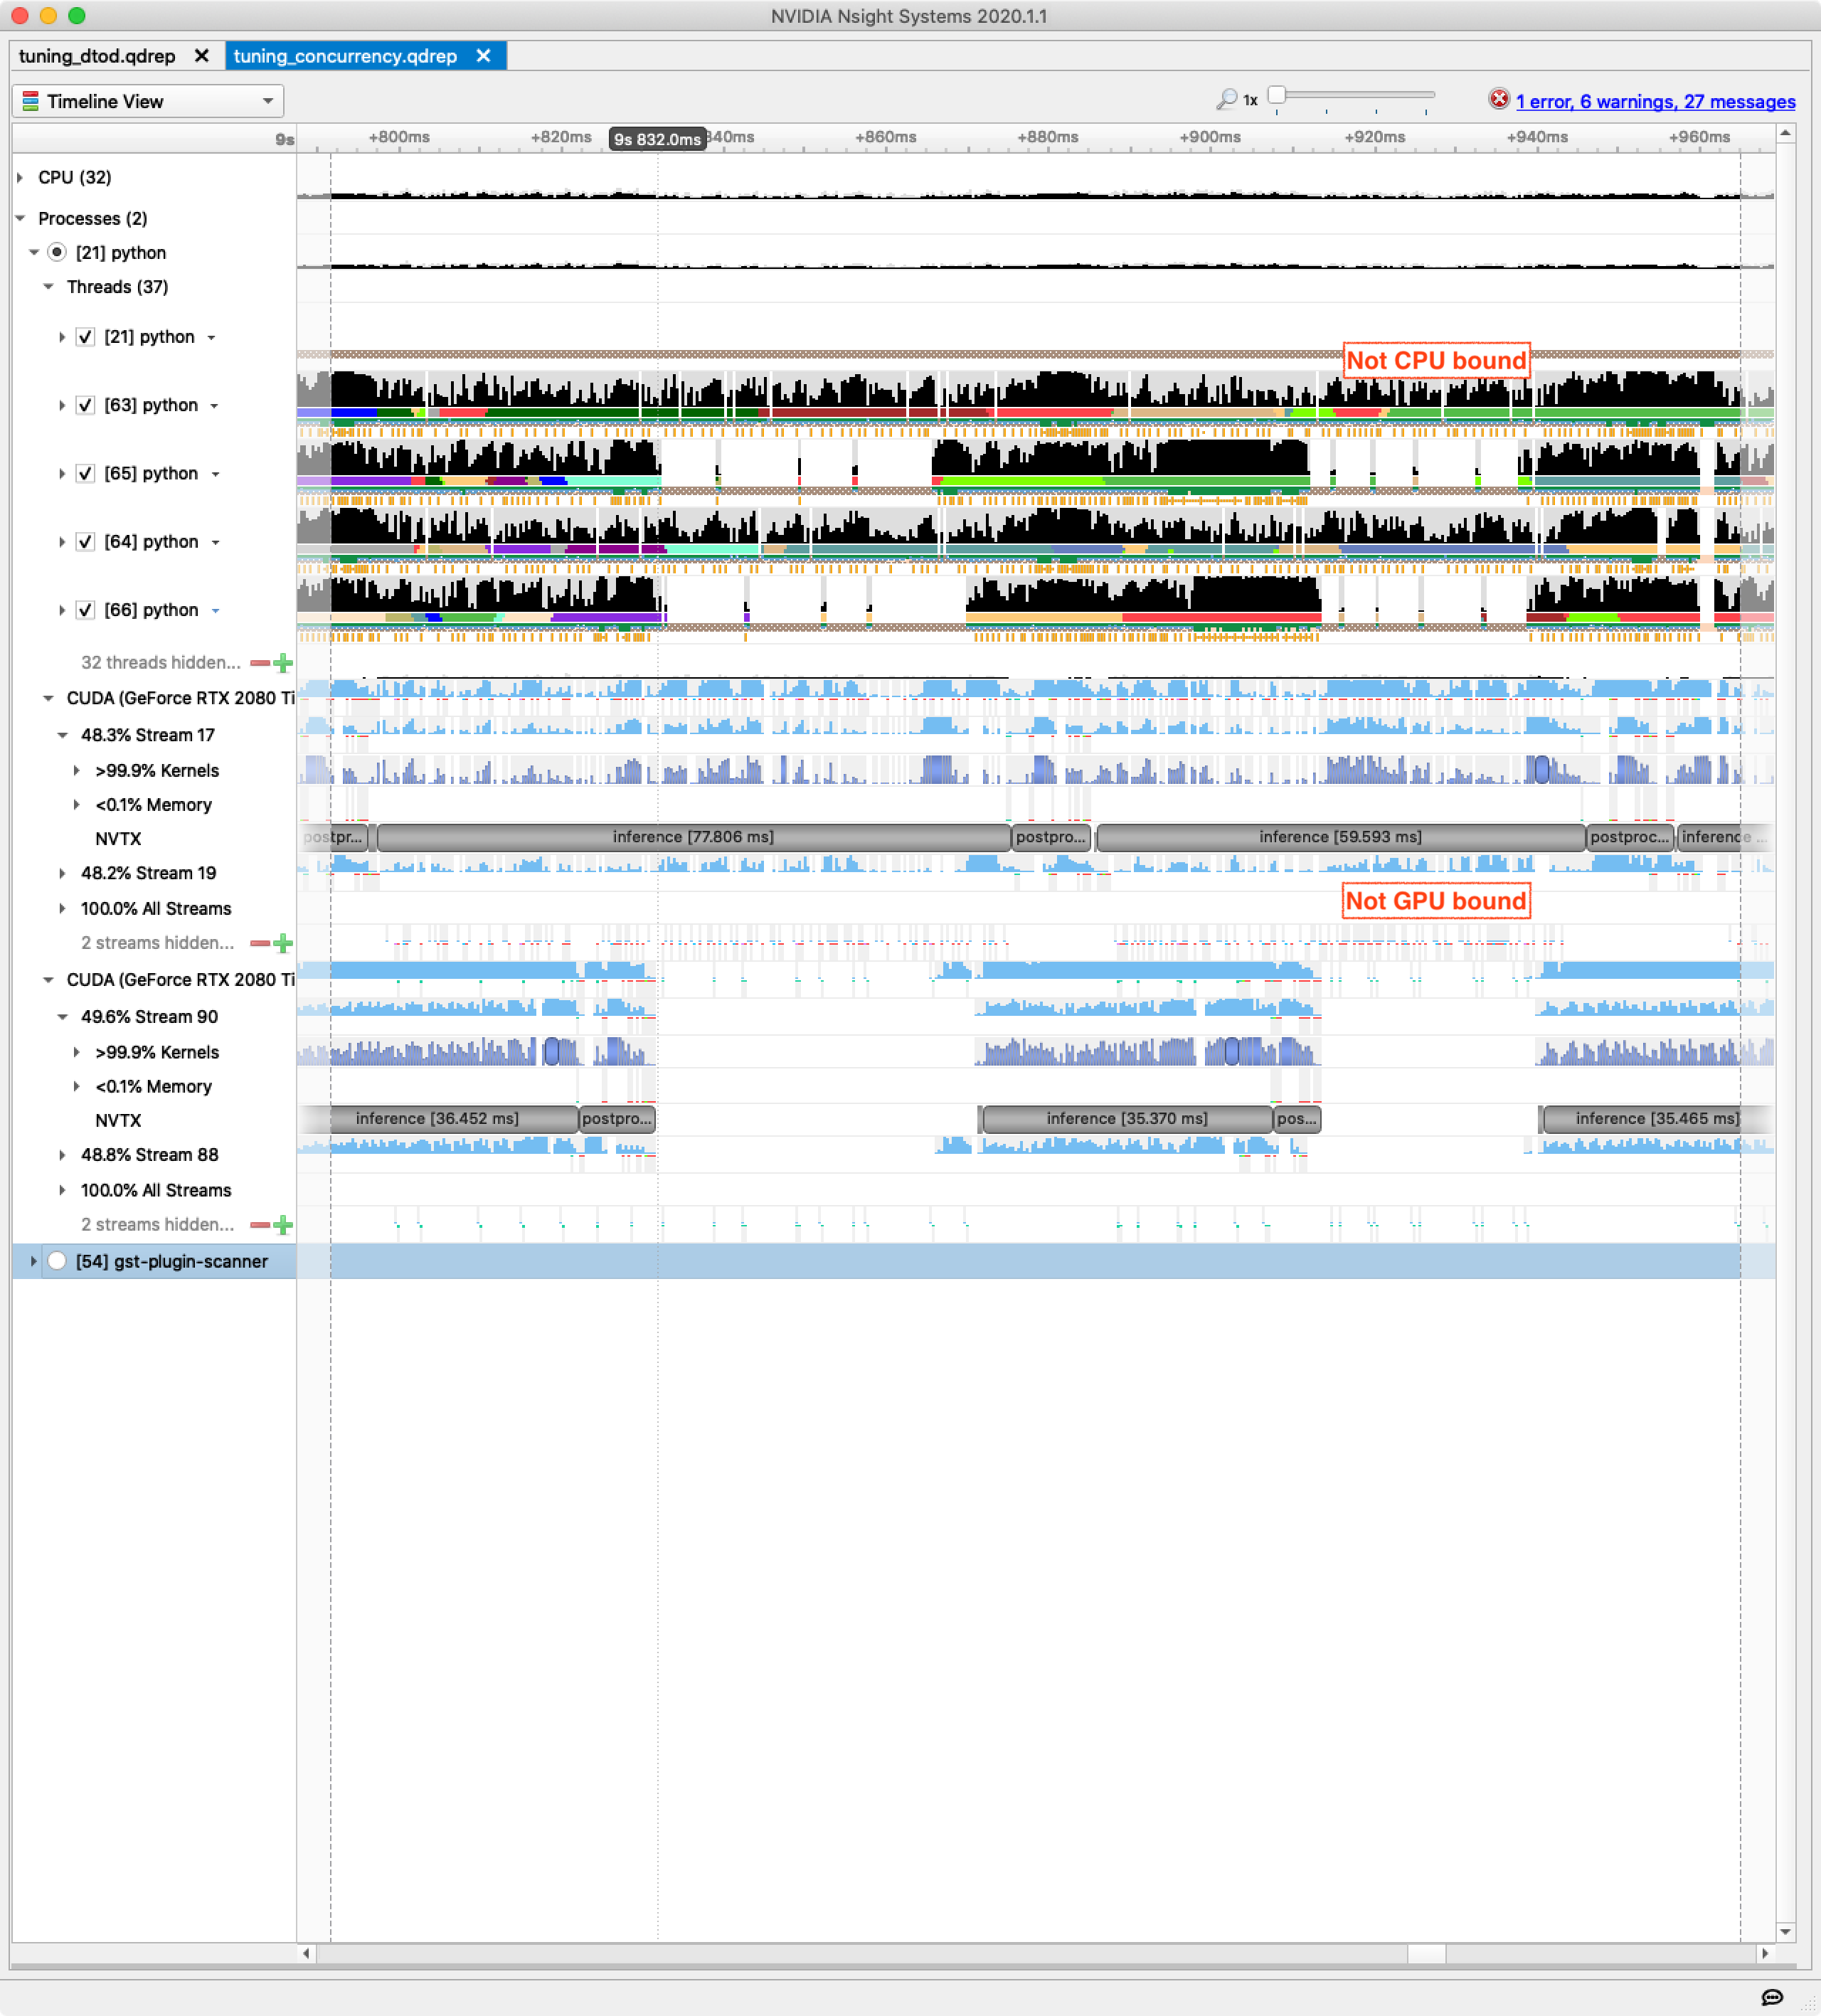
While hunting for the new bottleneck I found that the video decoding and tensor creation stage can operate at over 3000 FPS, so this is fine.
Throttled by the GIL #
On a hunch I decided to get a measure of the Global Interpreter Lock (GIL) load. If you are reading the code you’ll know that we are doing almost no compute whatsoever within Python (and therefore spend as little time as possible within Python holding the GIL), but we do have multiple concurrent Python threads submitting streams of operations to the GPUs.
Using a GIL sampling tool called gil_load I measured the GIL as being actively held over 45% of the time, and with processes waiting to acquire it over 30% of time. This is a problem.
To investigate the impact of this GIL contention on throughput, I added varying numbers of spurious GIL-consuming threads (which just do 1 + 1 repeatedly). Even when adding a single thread designed to consume approximately 10% of GIL time the throughput is immediately reduced (by around 50 FPS).
Conclusion #
Given the initial aim of pushing a Python-based pipeline to the limit, we have come far enough. The solution to Python’s GIL bottleneck is not some trick, it is to stop using Python for data-path code.
We’ve improved the pipeline a lot — from 9 FPS to 650 FPS — but the latest view of Nsight Systems still shows plenty of headroom left on the hardware. Drilling in also shows plenty of problems to fix — unexplained small memory transfers, unnecessary synchronization, etc.
My next post in this series goes deeper into production-oriented tools to see if we can solve these issues and push the throughput even higher: TorchScript, TensorRT and DeepStream.